
May 01, 2024
General
Big Data Visualization Techniques: Unlocking Insights from Complex Data
In 1999, "big data" was referred to as 1 GB. Nowadays, it represents vast quantities of information, measured in petabytes (1024 terabytes), exabytes (1024 petabytes), or even zettabytes (1024 exabytes).
Such data volumes may consist of billions or even trillions of records generated by billions of individuals worldwide.
So, how do companies deal with these massive silos? When vital insights begin to get lost in a sea of numbers, data visualization comes in handy. Data visualization tools not only help organize large volumes of data but also streamline informed-decision making and revelation of trends. In the business world, visualization is a valuable asset used in various stages, from making staffing decisions to customizing discounts for individual customers.
In this article, we will define what big data visualization is, observe its key techniques, and examine primary types, as well as provide a comparison chart of the 8 most common and effective data visualization tools.
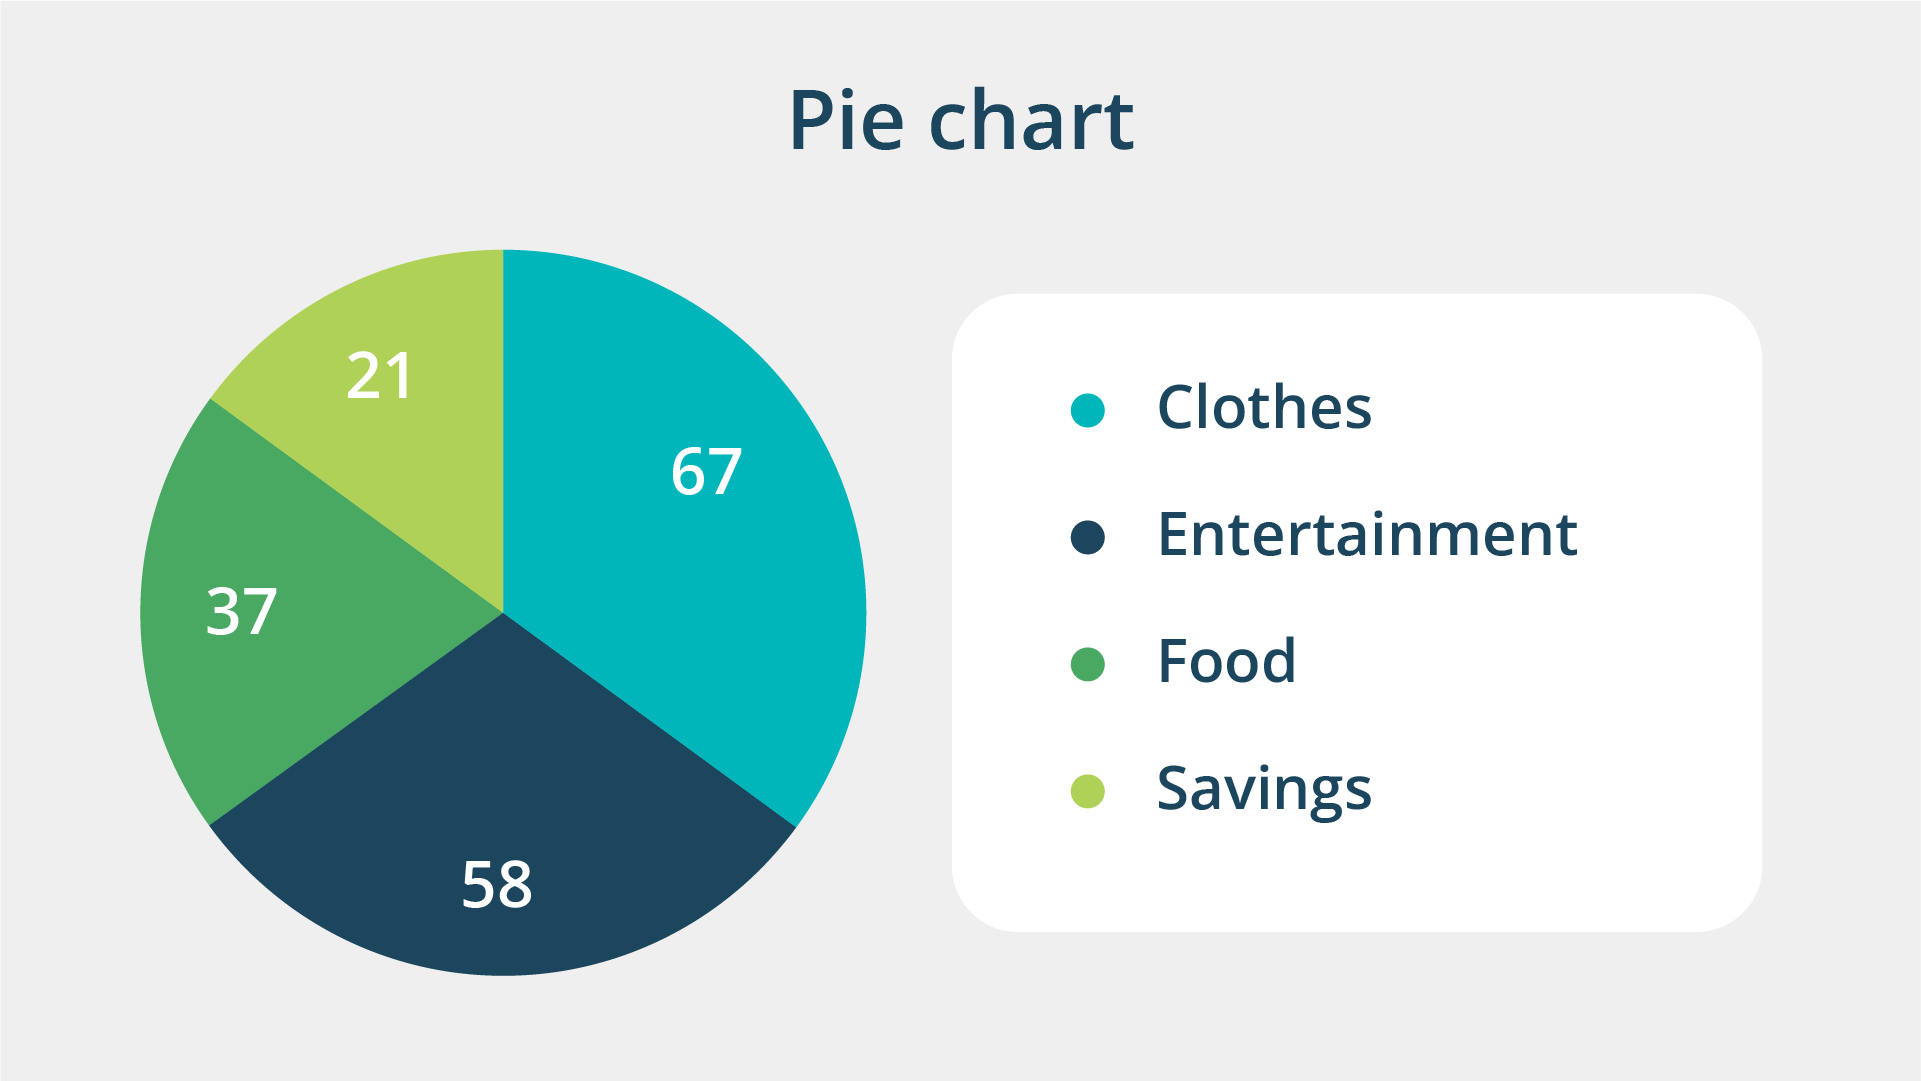 This visualization method is suitable for illustrating parts of a whole. However, it's recommended to avoid using it when there are over five indicators. It works well for showcasing one or two parts of a whole, such as a company's market share.
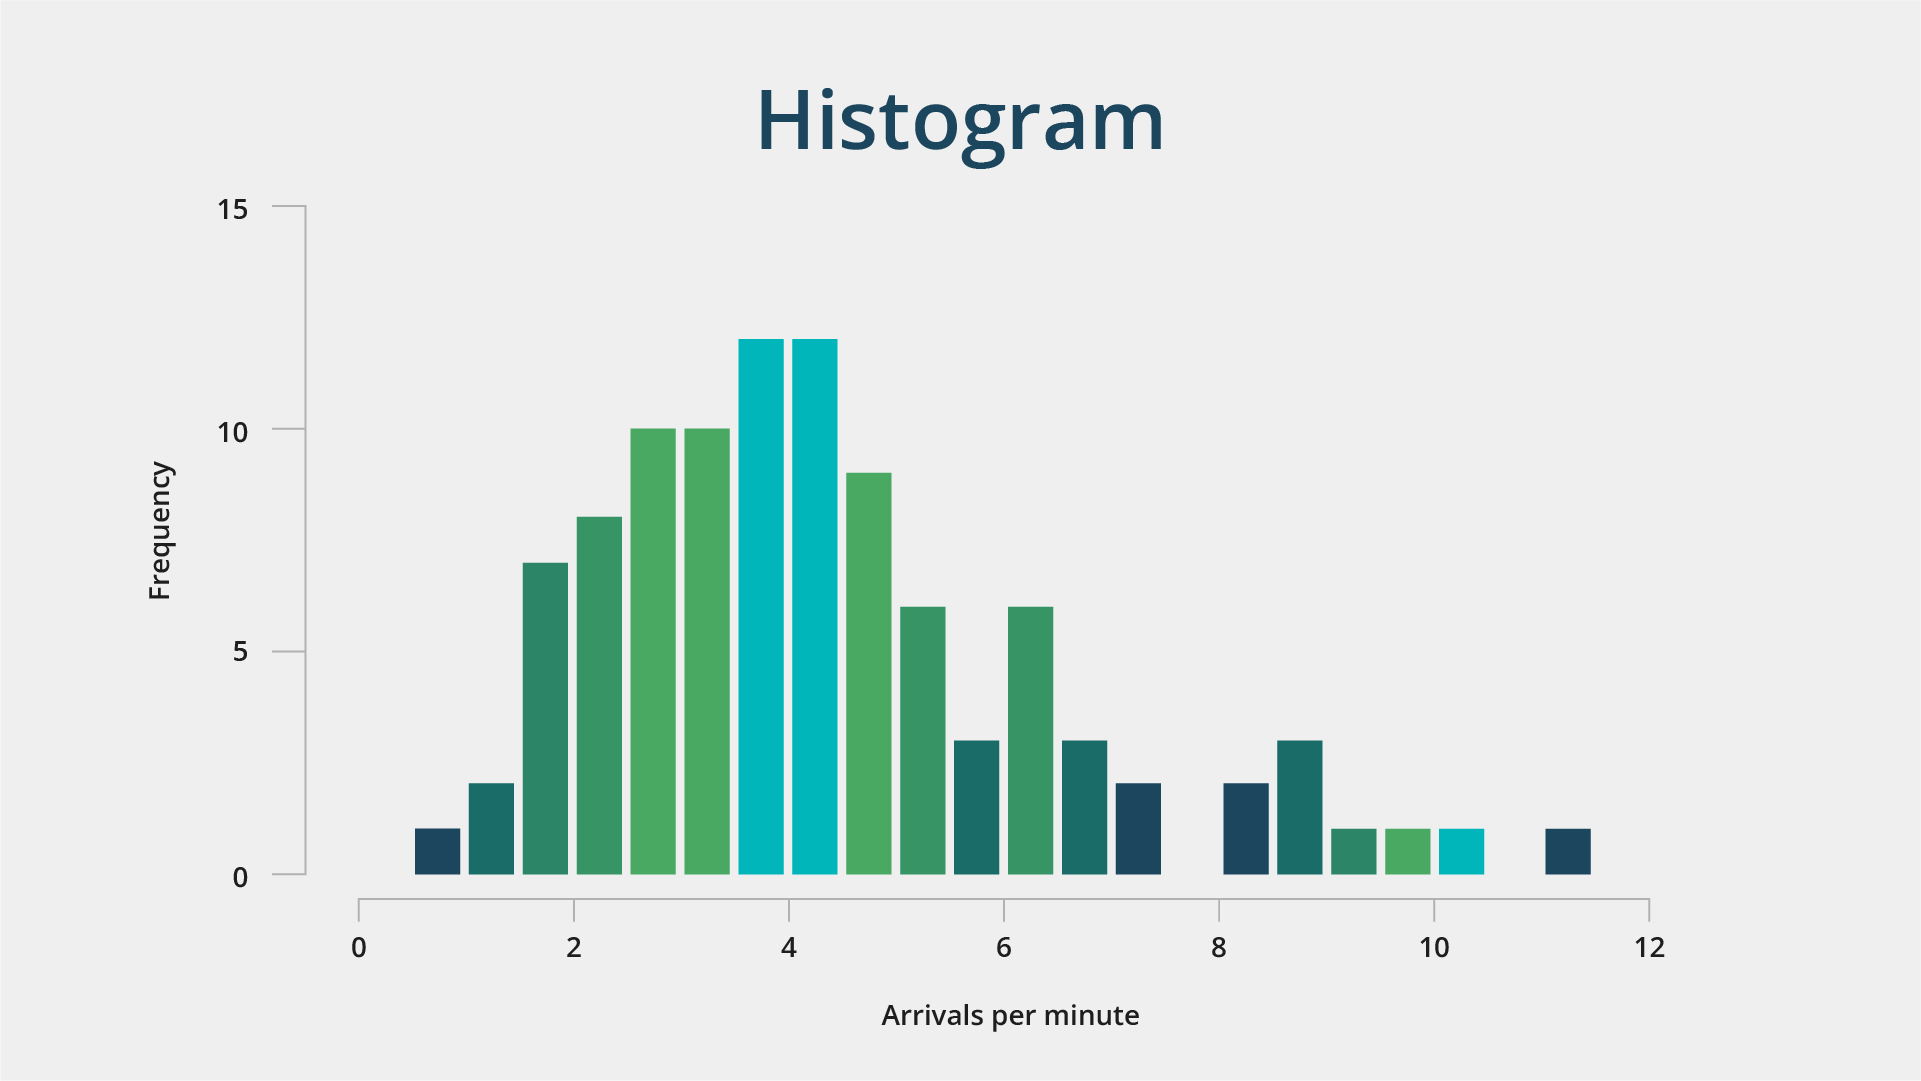 Histograms work perfectly for precise data comparison, as well for demonstrating relationships between different data points. They are particularly effective for visualizing frequent fluctuations.
Conversely, if changes are minimal, a line chart is preferable. For example, when illustrating currency exchange rates, a difference of a few cents may go unnoticed.
Histograms work perfectly for precise data comparison, as well for demonstrating relationships between different data points. They are particularly effective for visualizing frequent fluctuations.
Conversely, if changes are minimal, a line chart is preferable. For example, when illustrating currency exchange rates, a difference of a few cents may go unnoticed.
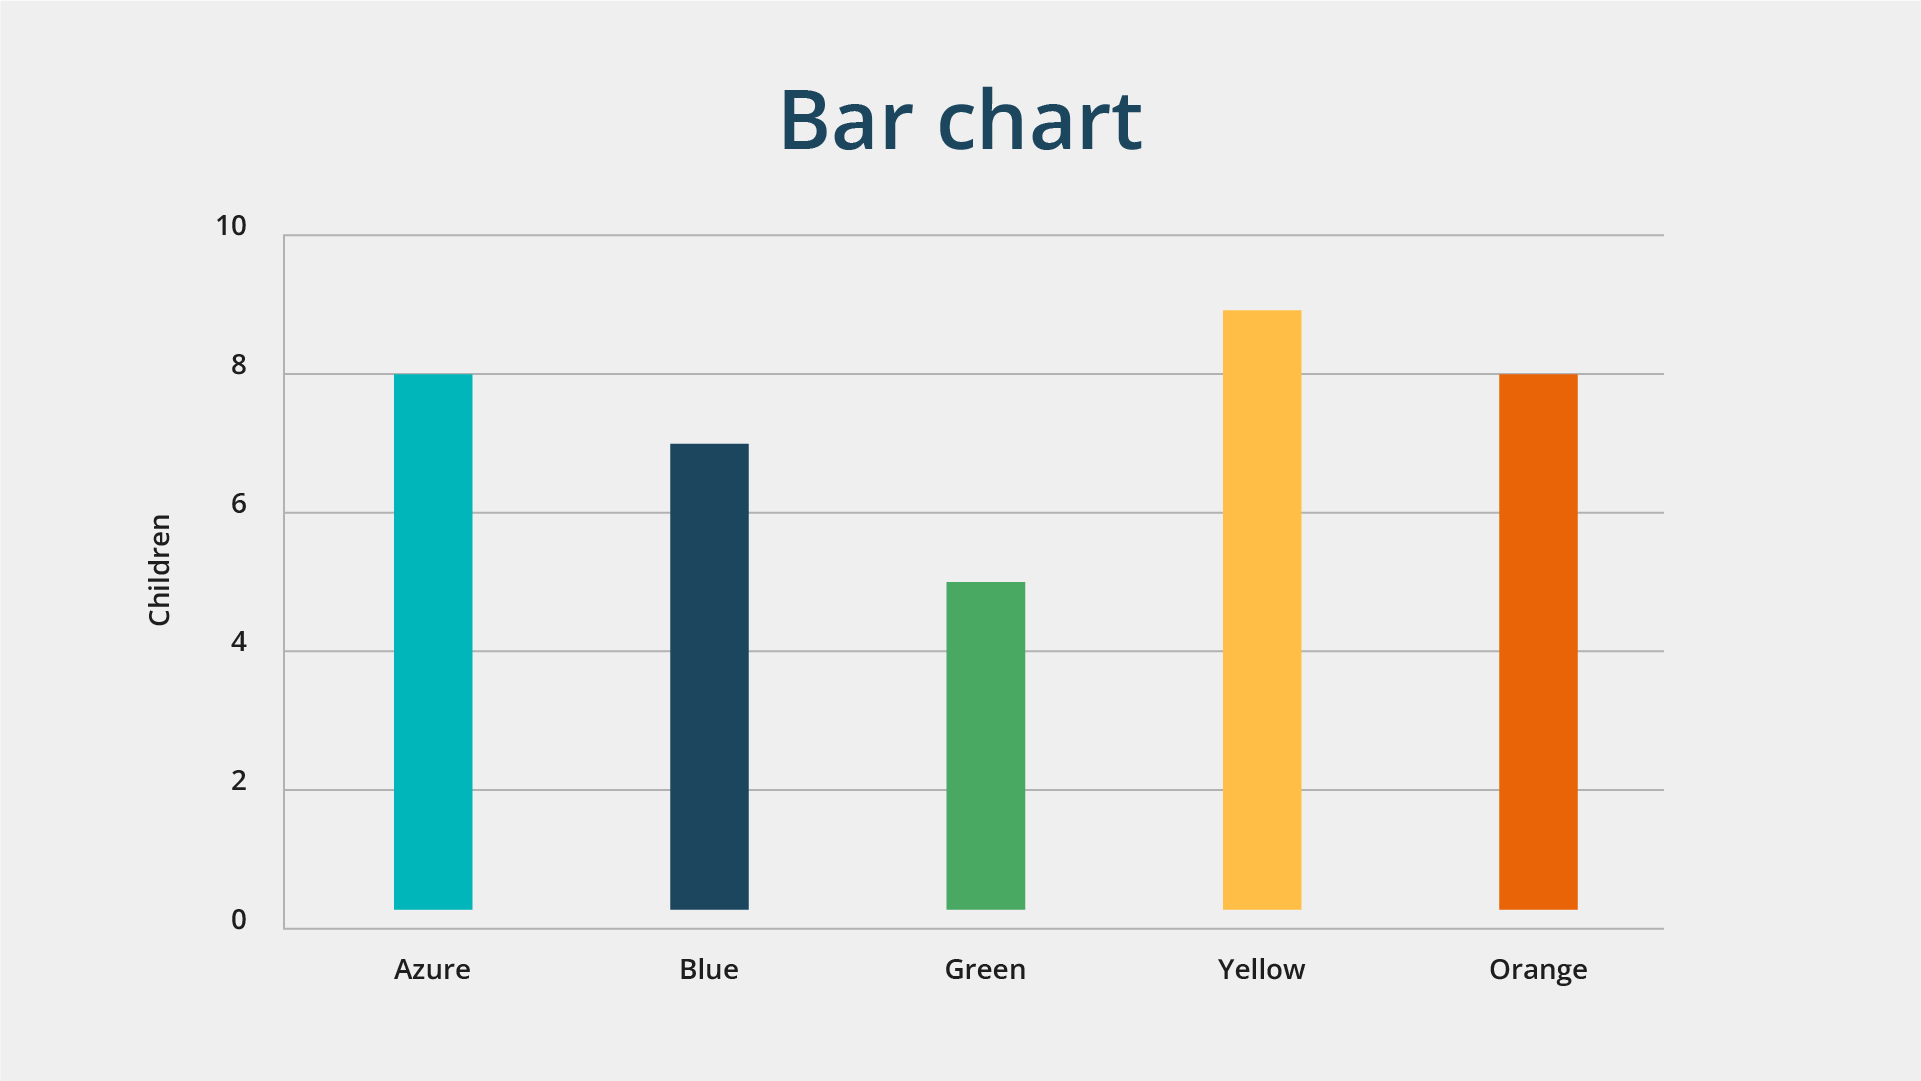 Similar to histograms, bar charts feature distinct spacing between columns, allowing for easy comparison without losing meaning. They are best suited for comparing categorical data when there are more than five indicators.
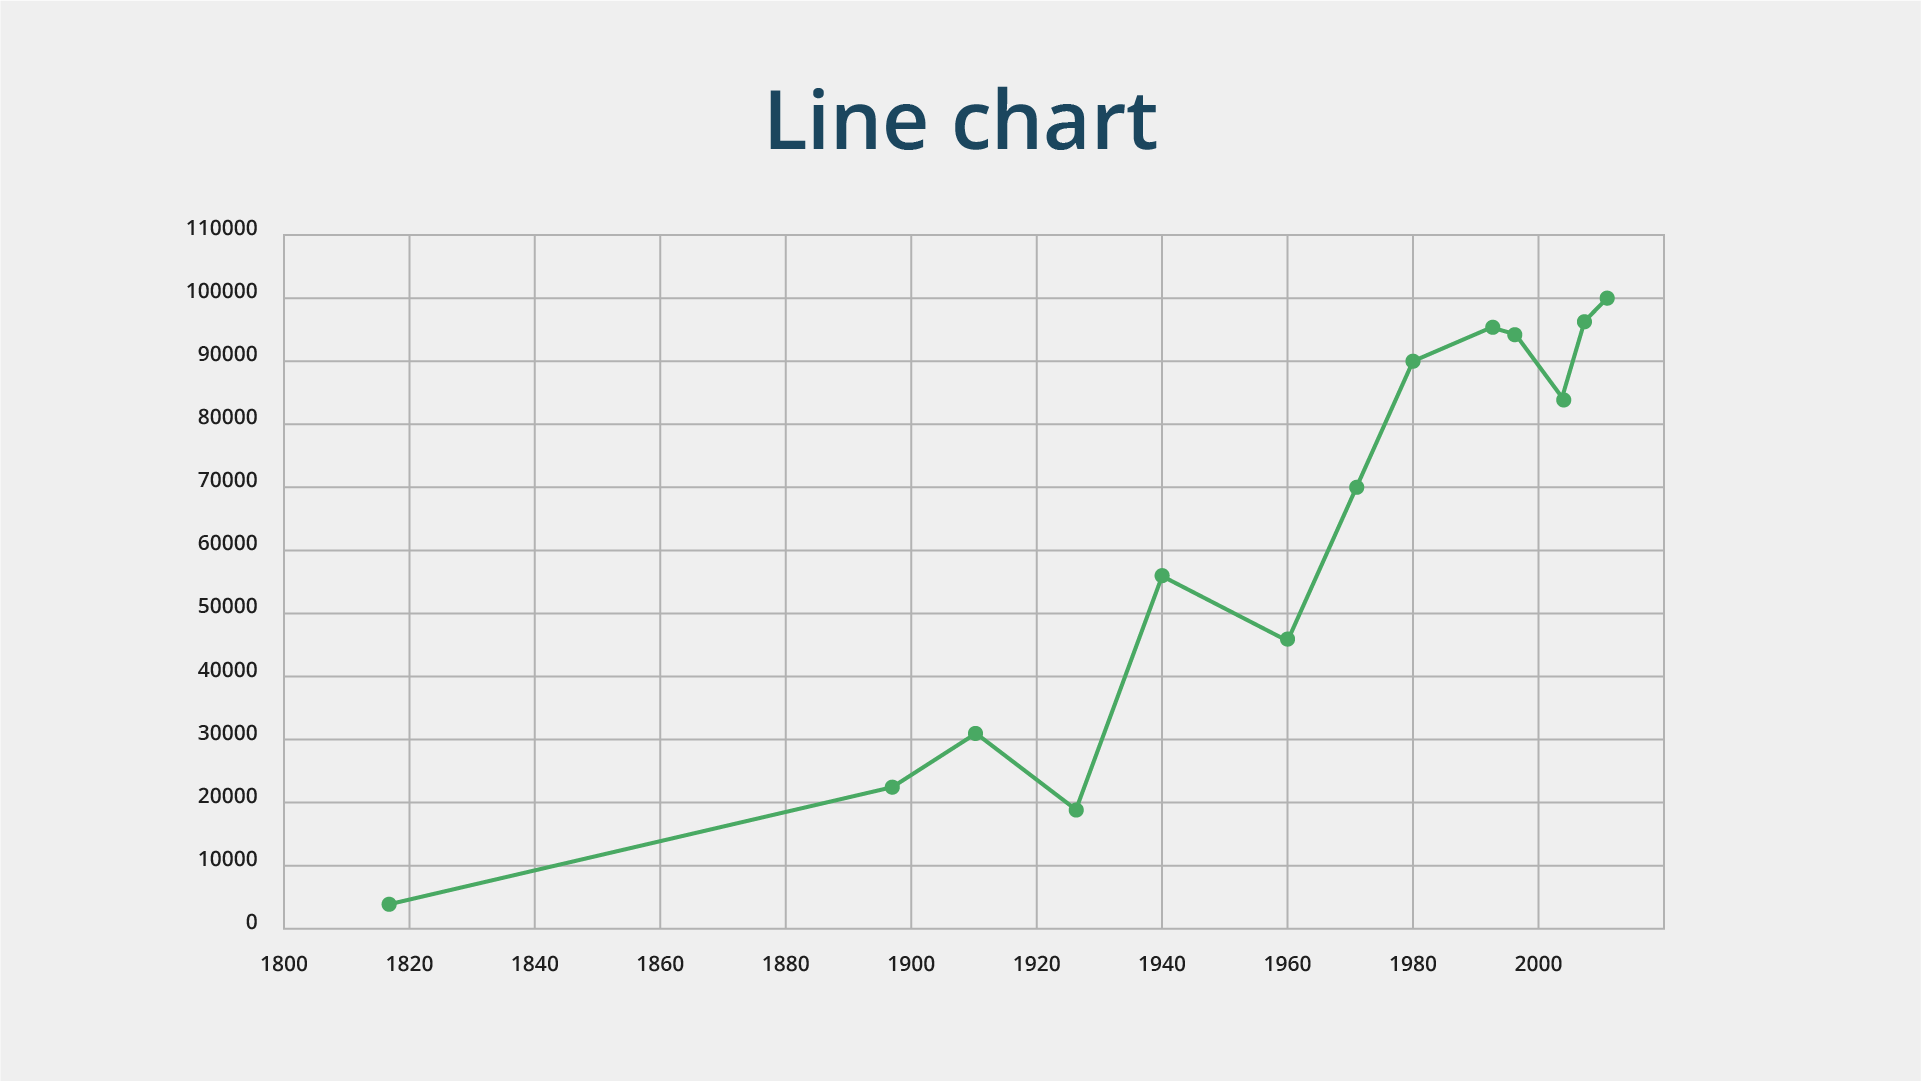 Utilizing points and curves, line charts depict data changes. They are useful for gauging overall trends, even when data is unavailable for every day.
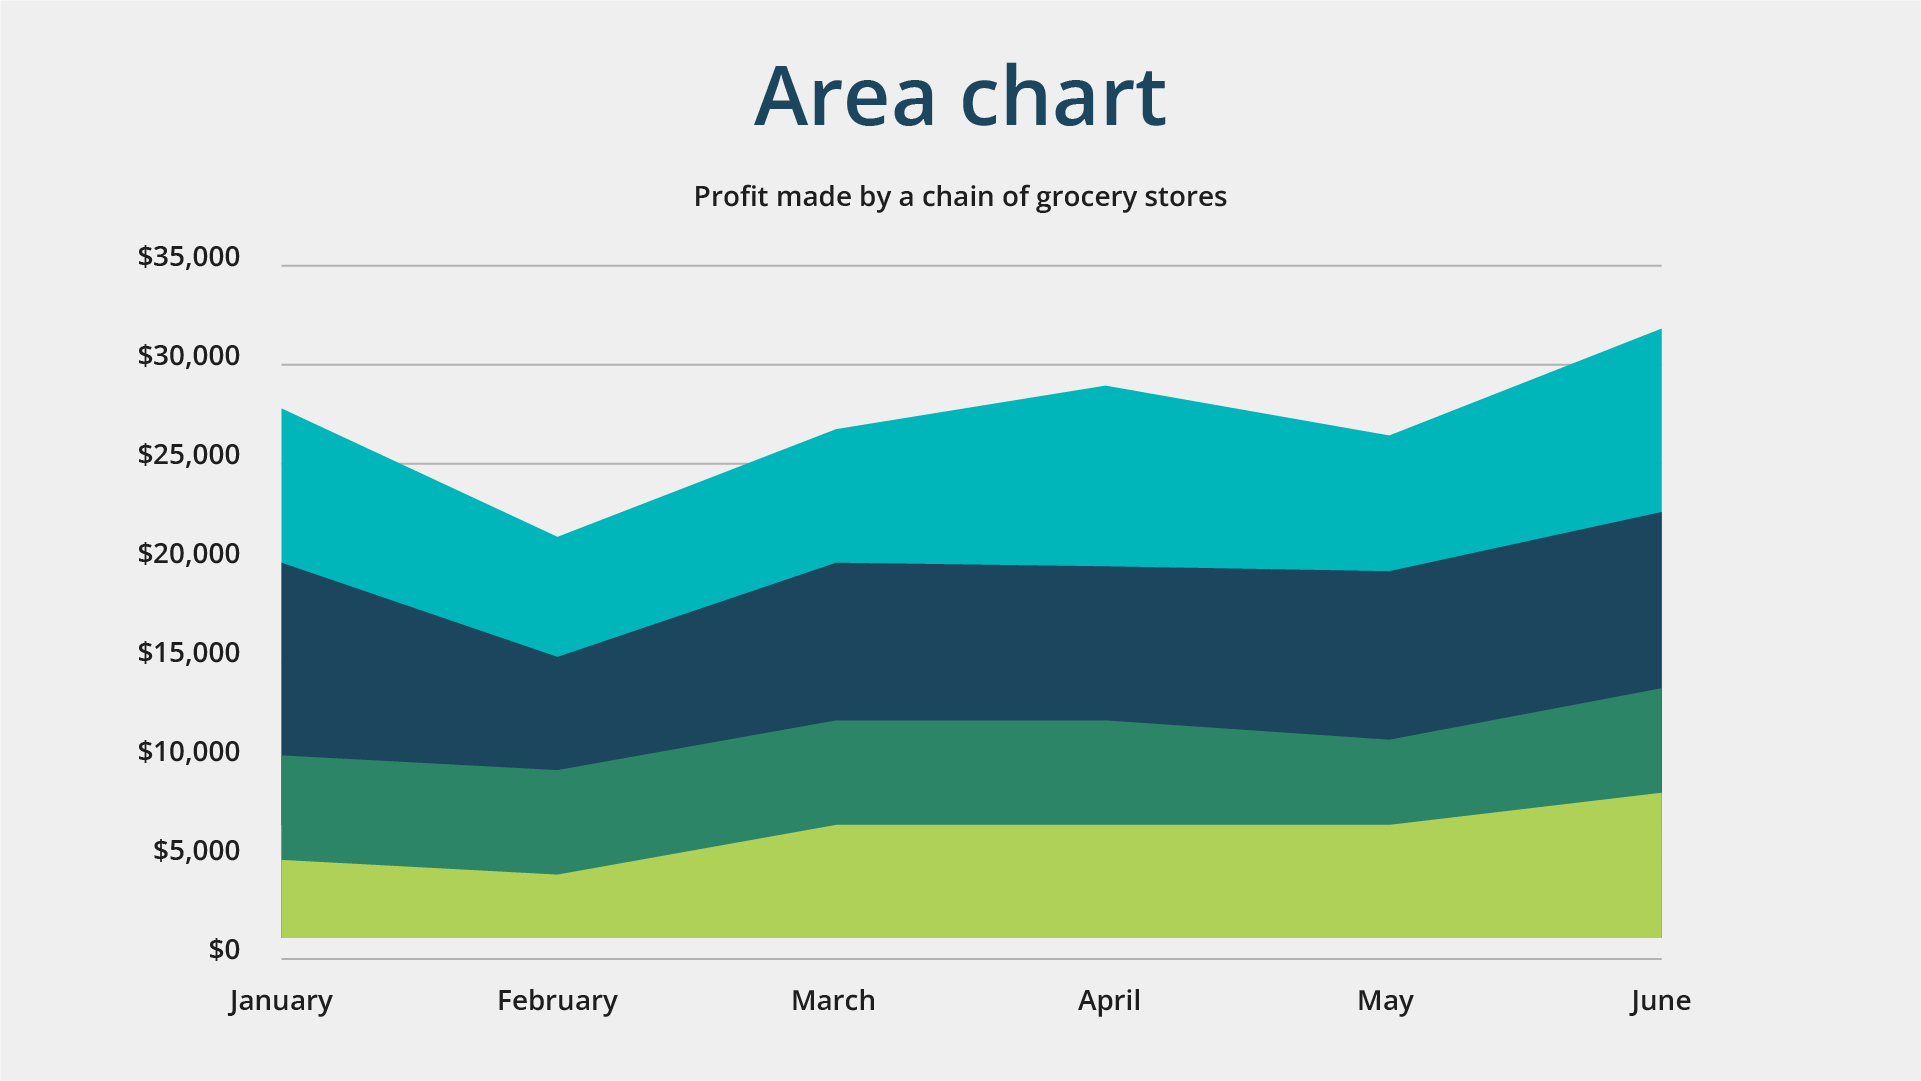 A variation of the line chart, area charts display quantitative data, often over a period of time. For instance, they can illustrate a company's monthly expenditures on logistics, employee salaries, and taxes, providing insights into changes over time.
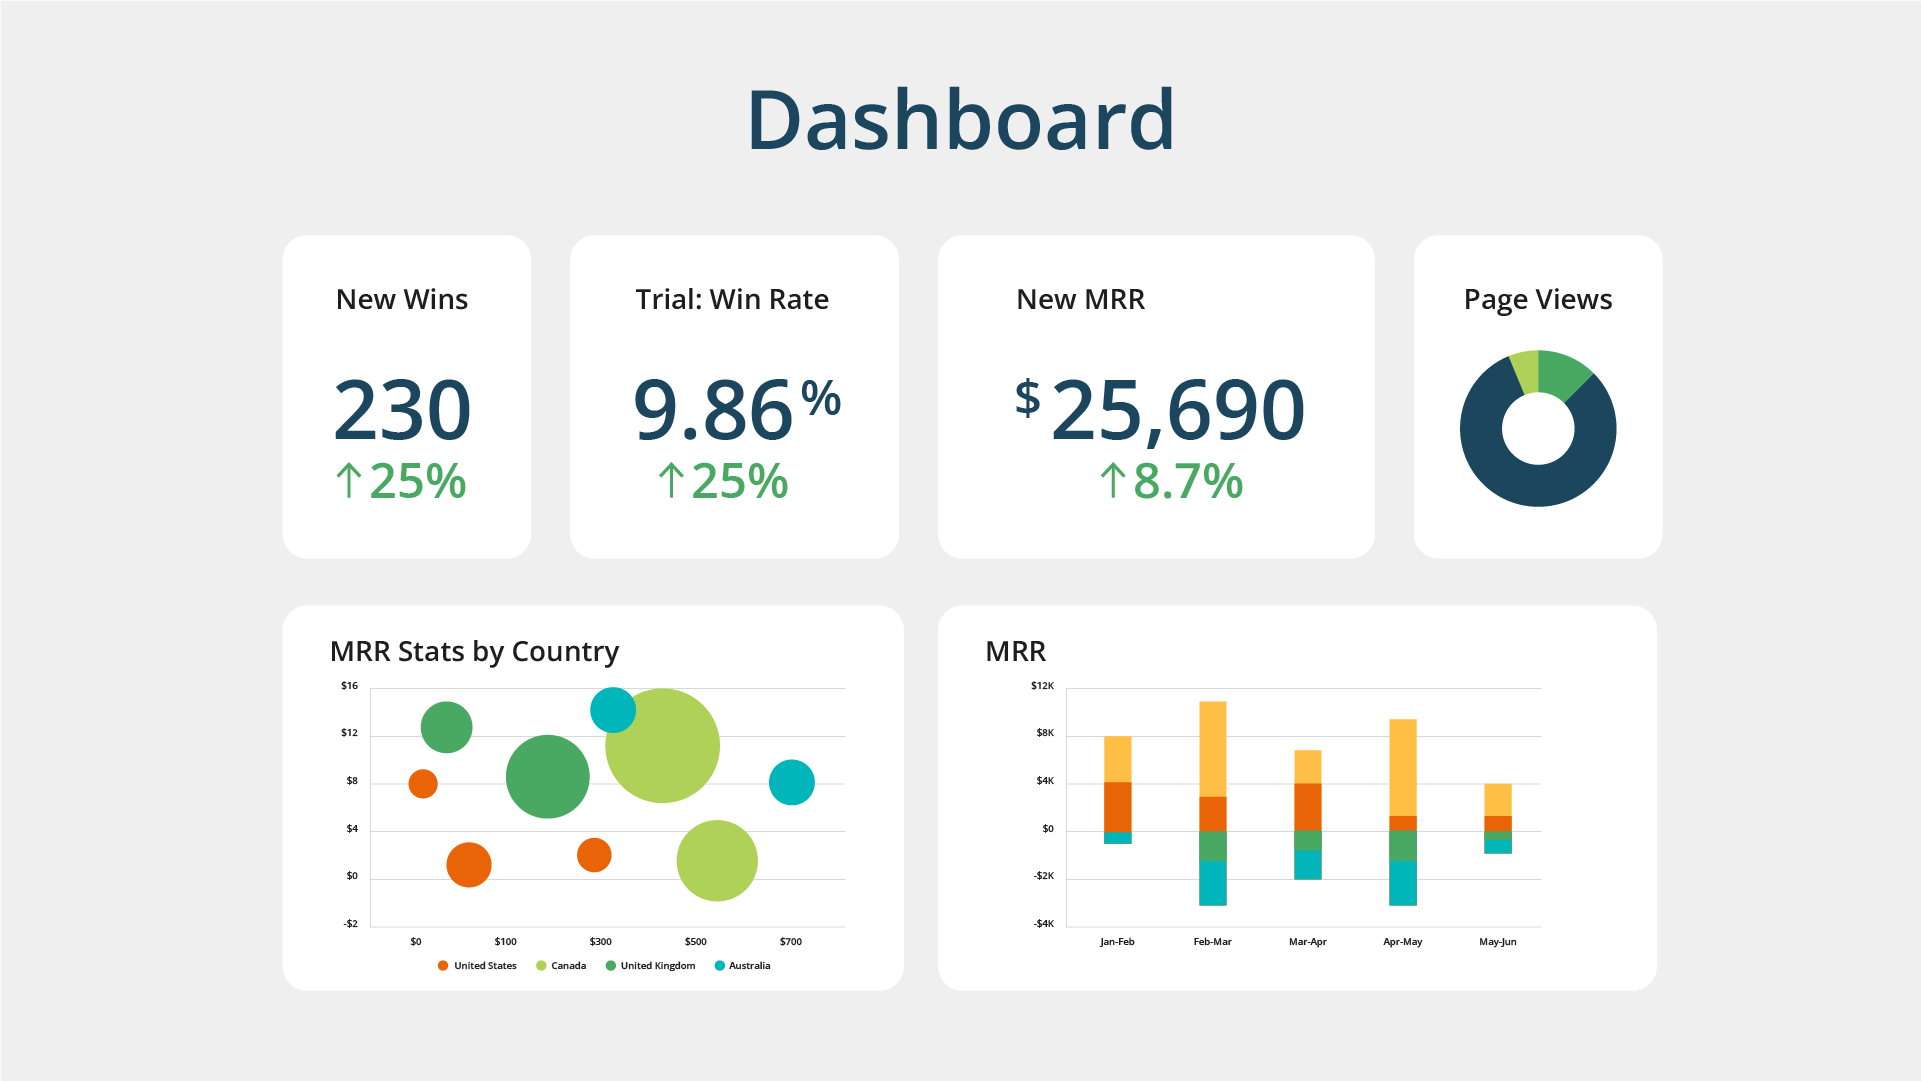 Businesses often analyze datasets from various platforms and systems. Dashboards serve as interactive data visualization tools, allowing users to display all analytics on one screen. Unlike static graphics, dashboards are dynamic tools that support real-time information updates.
They enable filtering, and selecting one element can trigger changes in dependent visualizations. Multiple team members can access dashboards, facilitating collaborative work where each member oversees their respective area.
Businesses often analyze datasets from various platforms and systems. Dashboards serve as interactive data visualization tools, allowing users to display all analytics on one screen. Unlike static graphics, dashboards are dynamic tools that support real-time information updates.
They enable filtering, and selecting one element can trigger changes in dependent visualizations. Multiple team members can access dashboards, facilitating collaborative work where each member oversees their respective area.
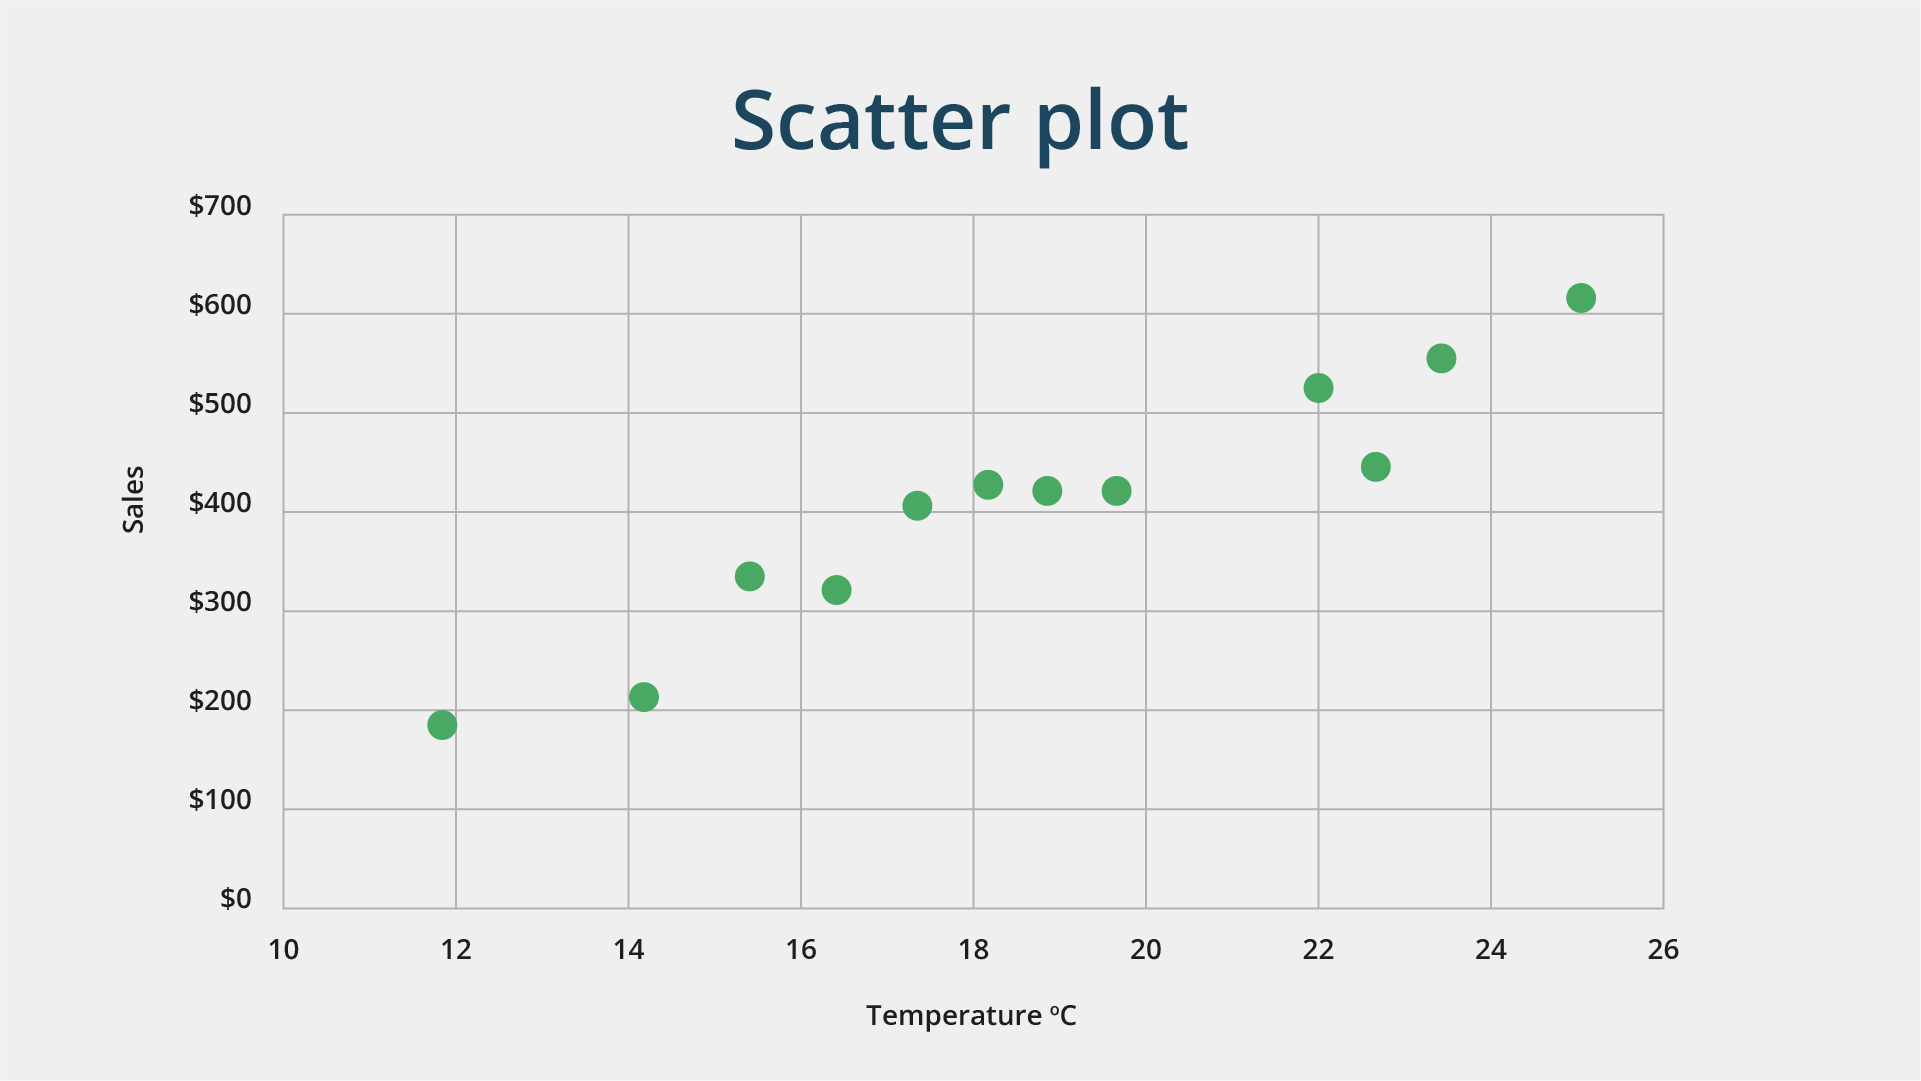 Scatter plots serve as valuable tools for showing relationships between two variables and are frequently used in regression data analysis.
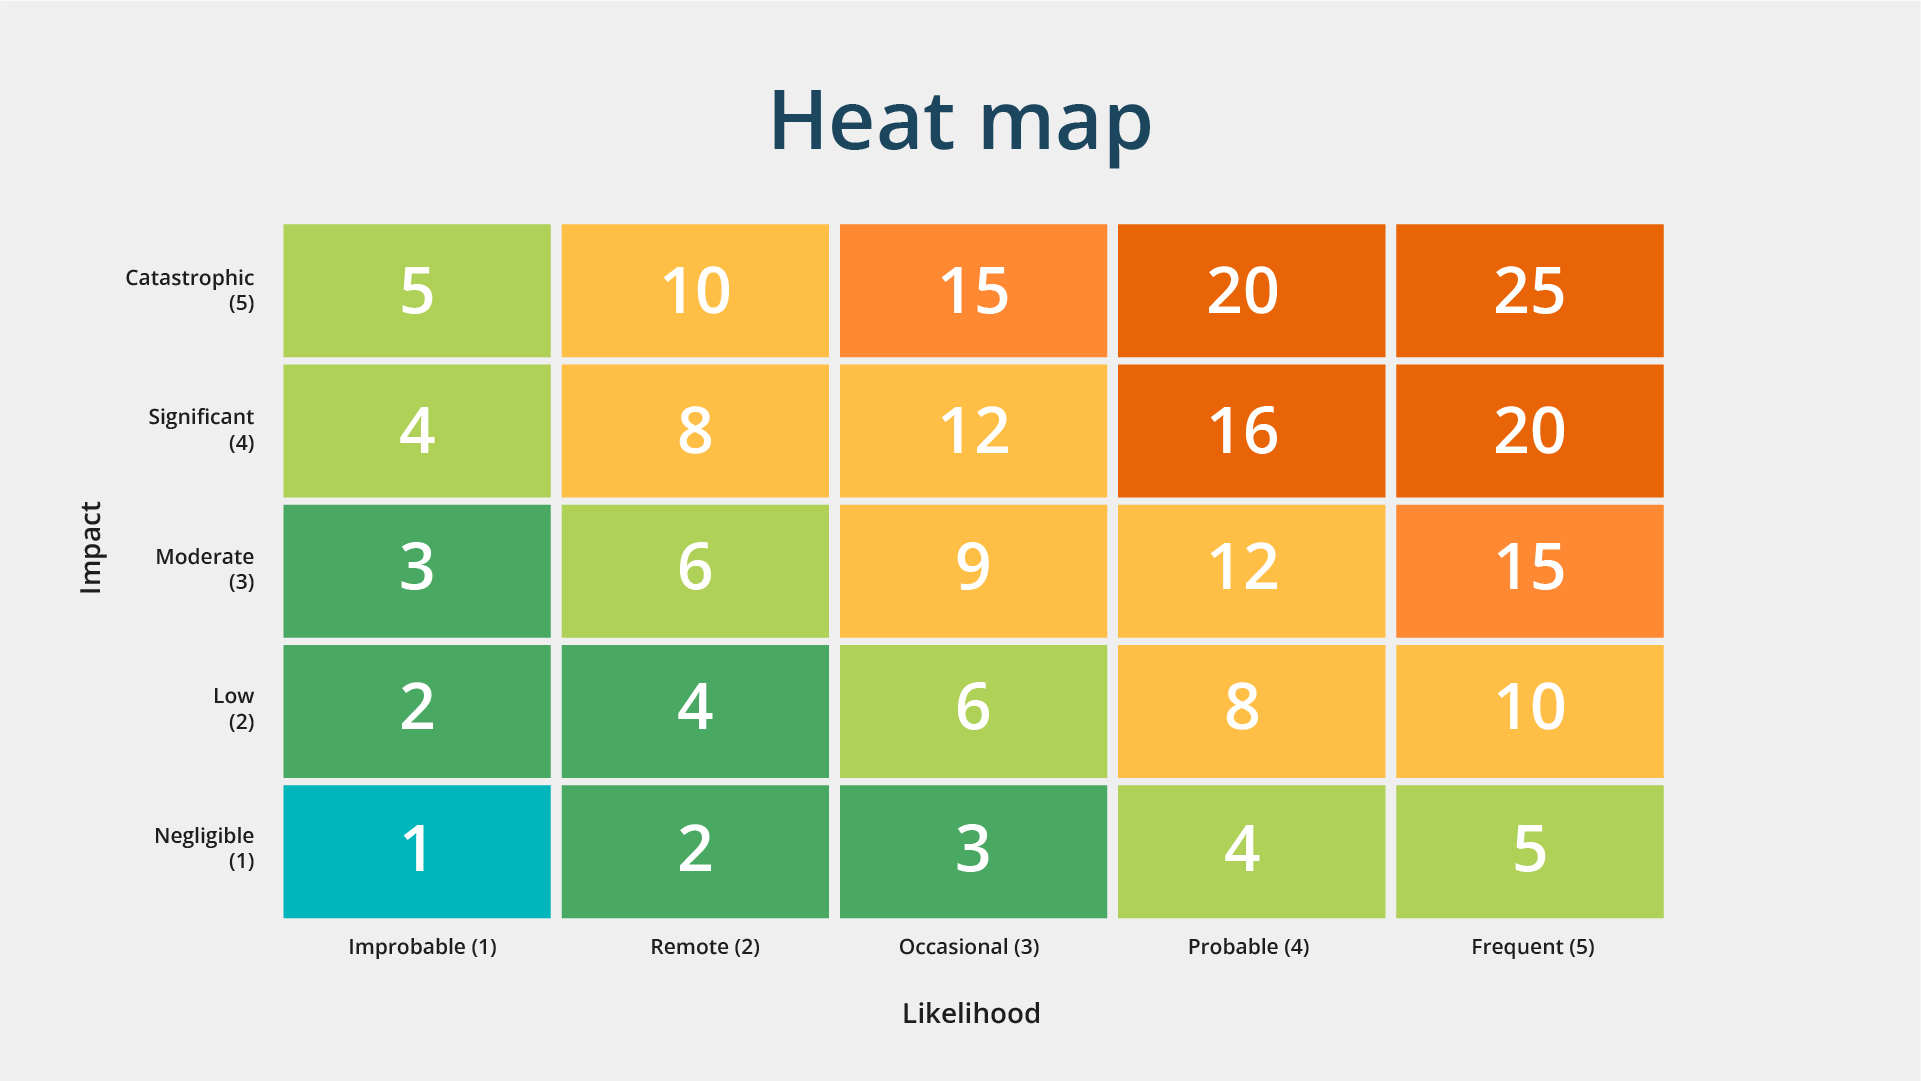 This graphical representation is instrumental in visualizing behavioral data based on location, whether it's geographical coordinates on a map or interactions on a webpage.
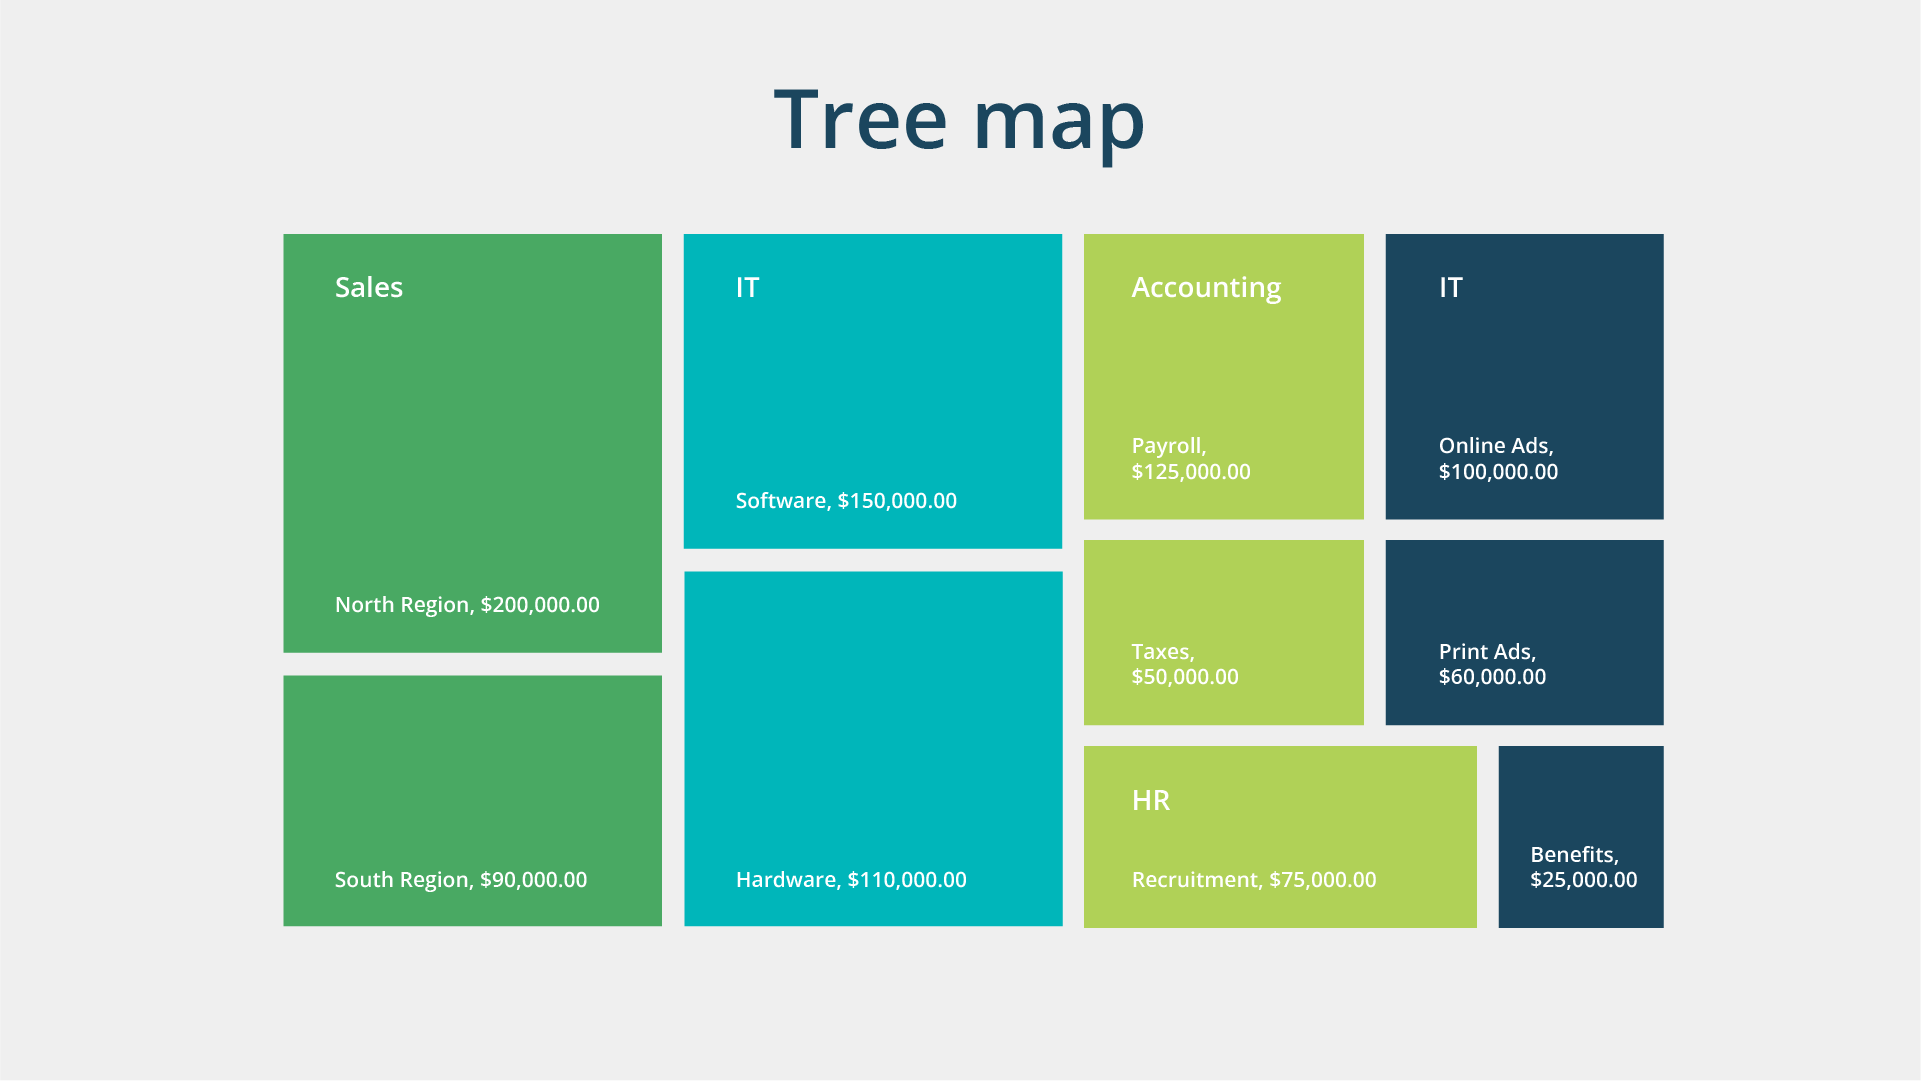 Tree maps depict hierarchical data through nested shapes, usually rectangles. They are perfect when comparing proportions between categories by visualizing their relative area sizes.
What is data visualization and why do companies need it?
Besides the myriad of tools available for data mapping, cleaning, and analysis, data visualization tools serve as invaluable resources for making informed decisions regarding business processes and dynamics. Picture this: A product manager at a large-scale software development company strives to optimize the user experience for one of their clients' mobile apps. They have access to a wealth of data about user interactions, including page views, click-through rates, and user demographics. However, sorting through the raw data is challenging, making it difficult to identify patterns or areas for improvement. This is where data visualization tools can be helpful, allowing product managers and data analysts to gain insights more efficiently. In the scenario described above, through interactive dashboards and visual charts depicting user behavior, both product managers and executives can quickly identify trends, such as which features are most popular among different user segments or where users encounter bottlenecks in the app's navigation. In simple terms, data visualization is the visual representation of information and analytics using graphs, diagrams, maps, and dashboards. Unlike numbers in tables and documents, which can be hard to interpret, visual formats provide a clear and comprehensive view of relationships between processes, growth trends, and indicator dependencies.Three key principles of visualization
To ensure that visualization of analytical data truly adds value and isn't just another tool in the toolbox, it's important to adhere to certain principles.Principle 1. Logic
Before building a chart or diagram, establish a clear goal—what do you aim to communicate?- Define a specific objective for presenting information. Creating visuals just for the sake of it is a common pitfall.
- Organize data logically based on the objective: from broader to finer details or vice versa.
- Select the most appropriate type of data visualization that enhances information comprehension. For instance, a pie chart may not be suitable if there are numerous indicators or if the total doesn't sum up to 100%.
- Maintain consistency in chart types when presenting information. Using different chart types for comparison can confuse users.
- Directly label data on the chart to facilitate the brain's ability to grasp the complete picture and draw conclusions swiftly.
Principle 2. Simplicity
- Simplify visualization by minimizing unnecessary elements such as logos, dates, or visual clutter. A simpler graph leads to quicker comprehension.
- Opt for a concise design. Avoid 3D effects, as they distract readers from the information without serving any purpose.
- Remember, design should not overshadow the data and its insights. Avoid unnecessary distractions that do not convey useful information.
- Stick to the principle of one task per graph. Attempting to present all company information for the year in a single dashboard can overwhelm viewers.
Principle 3. Color
- Adhere to commonly accepted color conventions: highlight "correct" information in green and "incorrect" information in red. Be mindful of cultural differences if working with international partners.
- Maintain a consistent color scheme throughout your visualizations. Inconsistencies in color can lead to confusion and may inadvertently highlight certain data over others.
Key data visualization techniques
To ensure effective data visualization, analysts employ over 60 visualization techniques, including various types of diagrams, charts, dashboards, and maps. Let's explore some of the most popular visualization techniques and their respective purposes.Types of diagrams
This visualization method is suitable for illustrating parts of a whole. However, it's recommended to avoid using it when there are over five indicators. It works well for showcasing one or two parts of a whole, such as a company's market share.
Histograms work perfectly for precise data comparison, as well for demonstrating relationships between different data points. They are particularly effective for visualizing frequent fluctuations.
Conversely, if changes are minimal, a line chart is preferable. For example, when illustrating currency exchange rates, a difference of a few cents may go unnoticed.
Similar to histograms, bar charts feature distinct spacing between columns, allowing for easy comparison without losing meaning. They are best suited for comparing categorical data when there are more than five indicators.
Utilizing points and curves, line charts depict data changes. They are useful for gauging overall trends, even when data is unavailable for every day.
A variation of the line chart, area charts display quantitative data, often over a period of time. For instance, they can illustrate a company's monthly expenditures on logistics, employee salaries, and taxes, providing insights into changes over time.
Businesses often analyze datasets from various platforms and systems. Dashboards serve as interactive data visualization tools, allowing users to display all analytics on one screen. Unlike static graphics, dashboards are dynamic tools that support real-time information updates.
They enable filtering, and selecting one element can trigger changes in dependent visualizations. Multiple team members can access dashboards, facilitating collaborative work where each member oversees their respective area.
Scatter plots serve as valuable tools for showing relationships between two variables and are frequently used in regression data analysis.
This graphical representation is instrumental in visualizing behavioral data based on location, whether it's geographical coordinates on a map or interactions on a webpage.
Tree maps depict hierarchical data through nested shapes, usually rectangles. They are perfect when comparing proportions between categories by visualizing their relative area sizes.
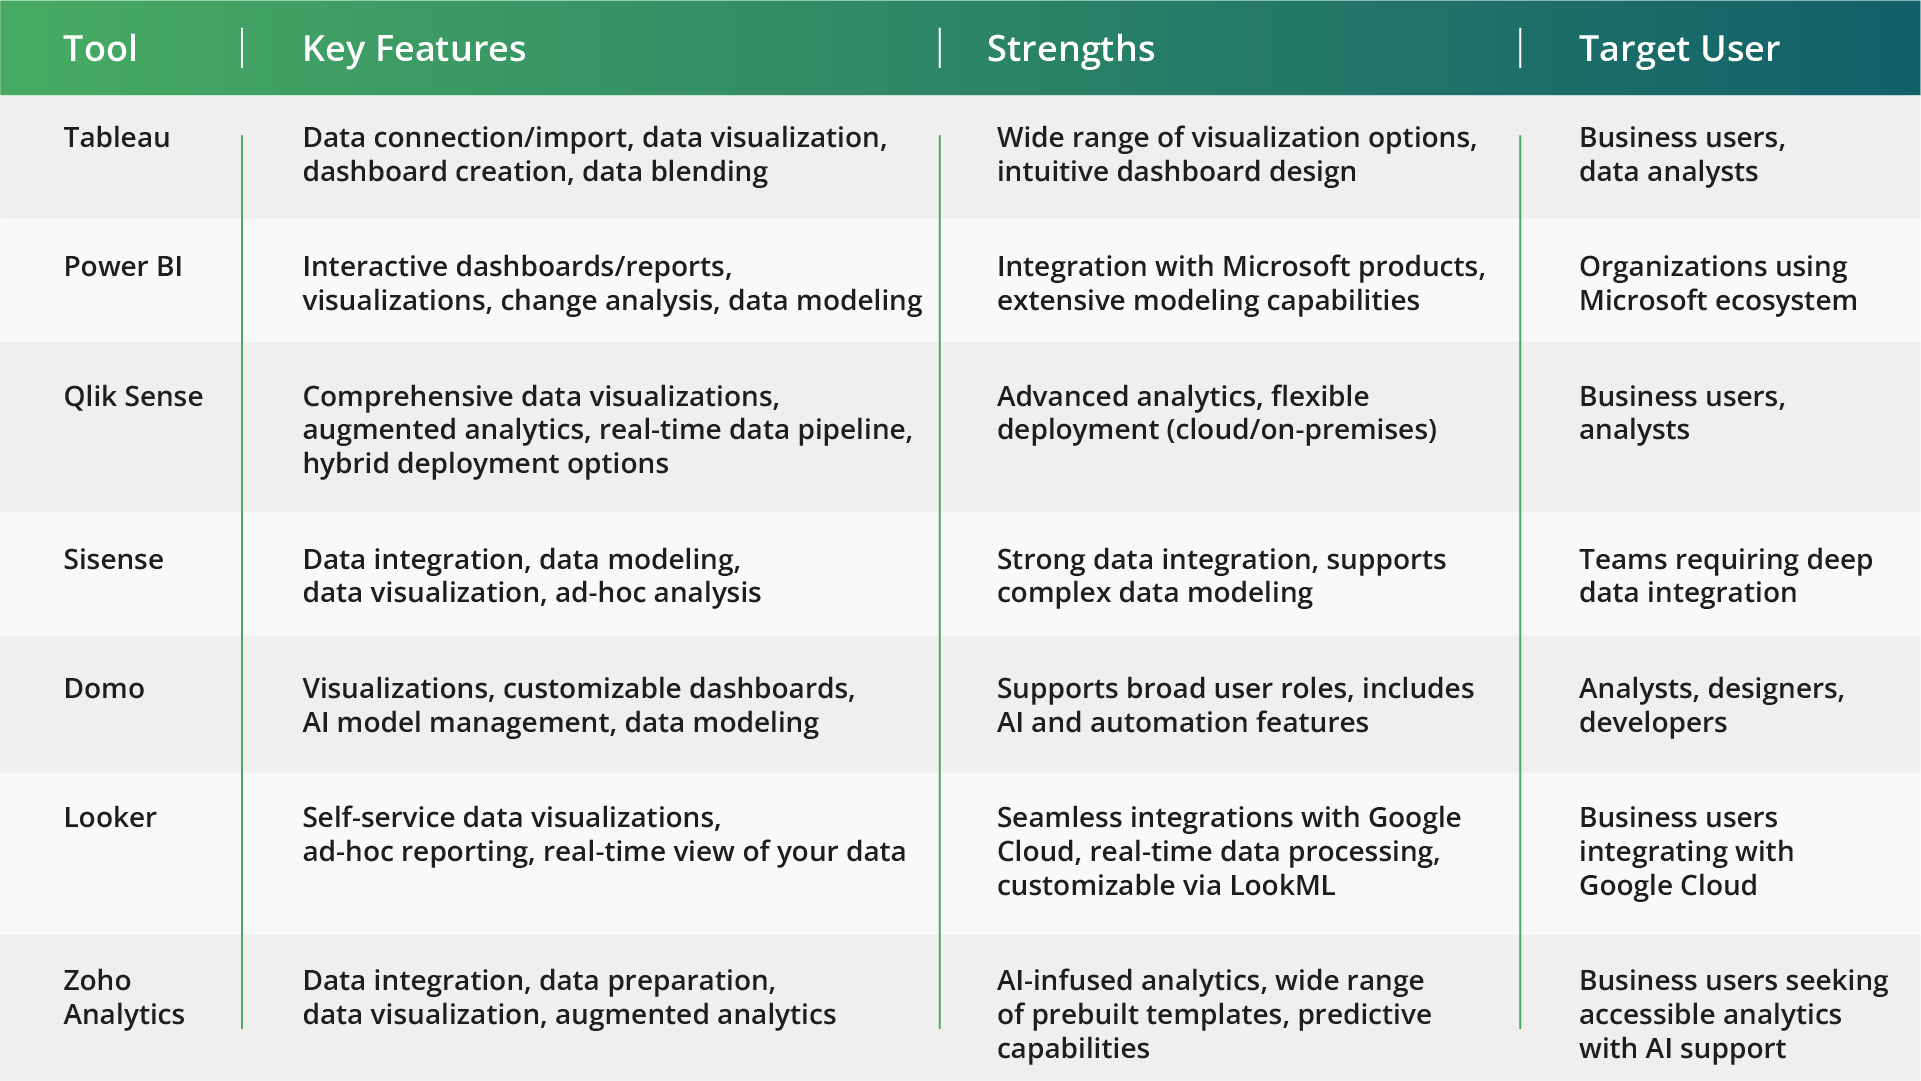
The 8 most popular data visualization tools
The modern software landscape offers a plethora of data visualization tools, ranging from free online services to expensive corporate packages like Excel, Google Sheets, Google Data Studio, RStudio, Tableau, Power BI, QlikView, OWOX BI Smart Data, and SAS. Most of them not only provide built-in tools for dataset analysis but also allow customization and adaptation of source code to suit specific projects. Some also allow for the creation of interactive dynamic reports. Notably, some of these tools (Chart.js, Raw, Dygraphs, ZingChart, FusionCharts Suite XT, D3.js, and many others) are plugins or libraries that can be integrated with other tools used by Data Scientists. Below is a comparison chart with the most popular data visualization tools organized by their core features, strengths, and intended user groups, to help you choose the right tool based on your specific needs and business context.
The bottom line
Transforming complex data into captivating visuals isn't just about making informed decisions; it's about boosting innovation and seizing a competitive advantage. With the right data visualization tools, your organization can turn data into a story—a story that drives action and propels success. But not all tools are created equal. That's where Kanda comes in. With our expertise and tailored solutions, we empower businesses to achieve their tangible goals in using data to its maximum potential. With Kanda’s team of experts, you'll seamlessly integrate data visualization into your workflow, inspiring creativity, and fostering a culture of innovation. Let us be your partner in turning numbers into insights and actions. Contact our team today.Related Articles

Custom AI Development vs Off-the-Shelf Solutions: What Delivers Better ROI?
Key Takeaways Custom AI development costs more upfront but delivers stronger long-term ROI, especially for core business functions. Off-the-shelf tools get you started fast, but subscription costs scale quickly, and vendor lock-in is a real risk. Over 80% of AI projects fail, and the most common reason isn’t the technology, it’s misalignment between the solution…Learn More
Low-Code, No-Code, or Custom Build? How Enterprises Should Actually Decide
Key Takeaways Low-code accelerates app development for professional developers; no-code empowers non-technical users to build on their own. Custom development costs more upfront but offers full control over security, scalability, and integration. Hidden costs like vendor lock-in, licensing at scale, and security gaps can erode the savings platforms promise. Most successful enterprises use a hybrid…Learn More
Why Using Edge AI for Real-Time Analytics Is Your Next Best Decision
Key Takeaways: Edge AI processes data locally in 1–10 ms, compared to 50–200 ms with cloud-based analytics, making it critical for time-sensitive operations. Organizations can cut data transmission costs by up to 43% and reduce cloud-bound traffic by over 90% by filtering data at the edge. Industries like manufacturing, healthcare, autonomous vehicles, and smart cities…Learn More
Why Human-in-the-Loop AI Is Necessary in the Age of Automation
AI is spreading through businesses much faster than most people anticipated. Data from a Fullview report shows that 78% of organizations now utilize artificial intelligence in at least one part of their operations, which is a significant jump from 55% back in 2023. At the same time, 71% of these companies are regularly using generative AI…Learn More

